Web Scraping for Real-Time Energy Data Visualization
August -2021
How It Works
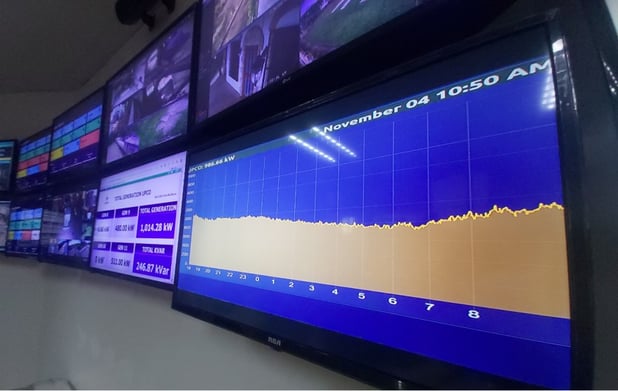
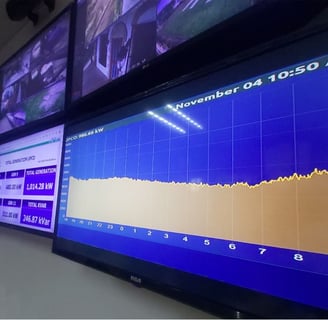
At Utila Power Company, there was no centralized way to visualize the total energy output from the generators. The only available measurement tool was an industrial ION8400 meter, which lacked an easy method for data extraction. However, when connected to the network, it provided a web interface accessible only through Internet Explorer.
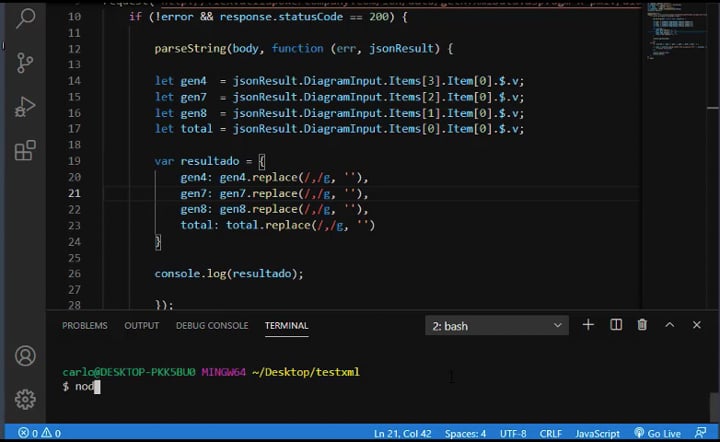
To bypass these hardware limitations, I developed a web scraping solution to extract energy data from the interface, storing minute-by-minute readings in a MySQL database. The data was then visualized using React ⚛️ and ChartJS 📈, enabling real-time monitoring of generation trends, demand, and system status.
Web Scraping for Real-Time Energy Data Visualization
This project involved extracting real-time energy data from an ION8400 industrial energy meter, which monitors the total power generation of the UPCO thermal power plant.
8/26/20211 min read