Real-Time Temperature Monitoring Dashboard
January to March -2021
Technical Implementation
To acquire the data, I intercept Modbus communication using NodeJS with the modbus-serial library. The temperature readings are then stored in MySQL tables.
On the dashboard side, I use React and ChartJS to visualize the temperature trends, ensuring clear and intuitive data representation.
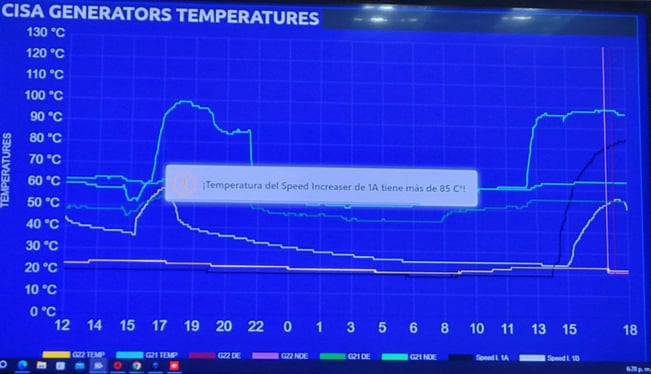
For alerts and alarms, I integrated SweetAlert2, providing instant notifications when temperatures exceed predefined thresholds.
Real - Time Temperature Monitoring Dashboard for Hydroelectric Generators
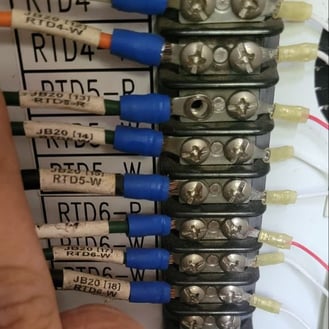
I developed a real-time dashboard to monitor the temperatures of each generator in a hydroelectric project. The temperature sensors (RTDs) are strategically placed in critical areas of each generator, such as:
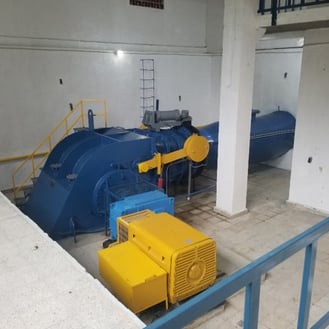
The Speed Increaser, which is the gearbox that connects to the turbine shaft.
The generator windings, where overheating can indicate potential failures.
Since temperature control is a critical factor in generator monitoring, this system provides real-time data to help prevent damage and optimize performance.
Real-Time Temperature Monitoring Dashboard
I developed a real-time dashboard to monitor the temperatures of each generator in a hydroelectric project.
1/15/20211 min read