2021 April
Dashboard for Reservoir Levels and Power Generation
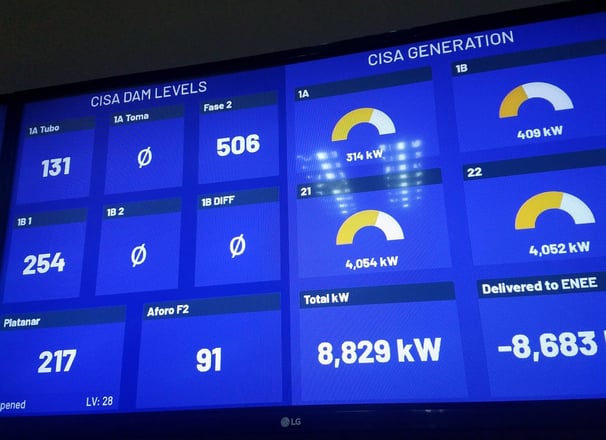
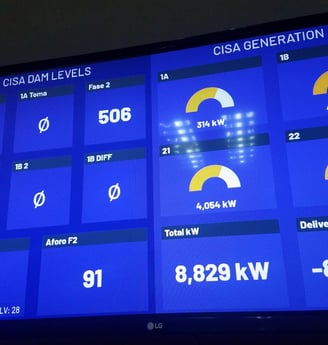
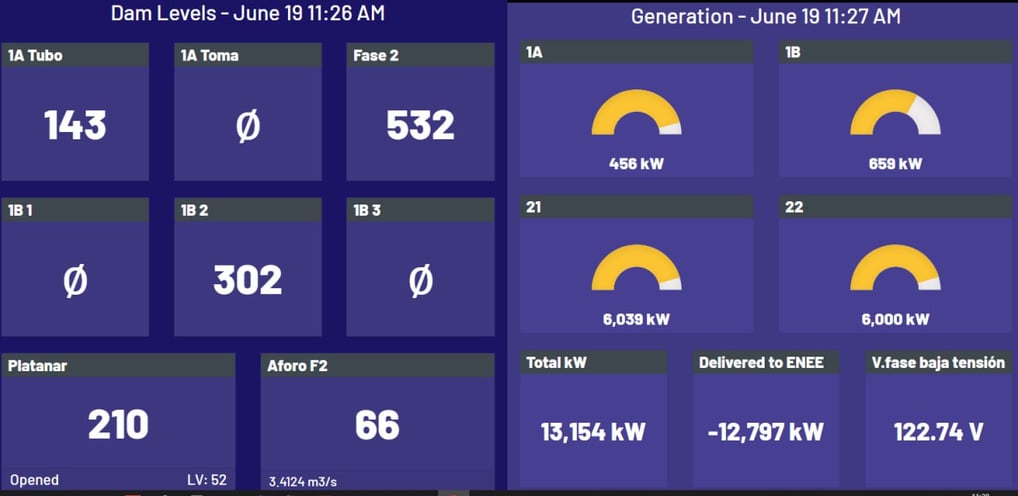
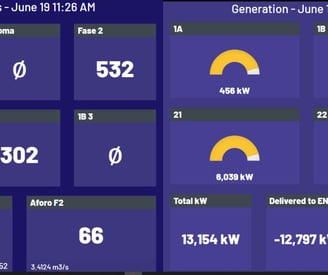
The development of a dashboard to display reservoir levels and the generation of each of CISA’s four generators (500 kW, 1 MW, 6.5 MW), as well as the low-voltage output.
The initial programming was done in PHP/MySQL, with data being sent from a Microcontroller Unit (Arduino) to an API. The dashboard I developed then consumed this API, retrieving stored sensor data and displaying it on the screen. Eventually, the system was migrated to NodeJS, ReactJS, and MySQL.
This achievement followed a previous situation where reservoir levels were manually recorded every two hours, resulting in high fuel and labor costs for measuring each of the four reservoirs. By implementing the dashboard, real-time monitoring of sensor levels and power generation has significantly reduced operational expenses, optimizing resource allocation and enabling more cost-effective decision-making.
Dashboard for Reservoir Levels and Power Generation
A real-time dashboard for monitoring reservoir levels, power generation, reducing manual labor and fuel costs through automation