2021 March
Dashboard for monitor water levels in the 4 main reservoirs
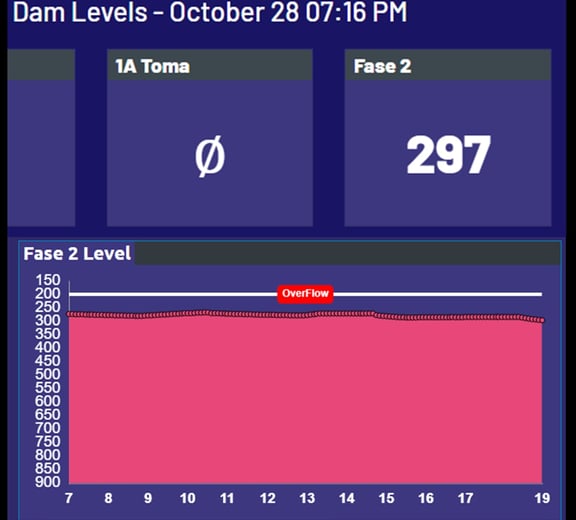
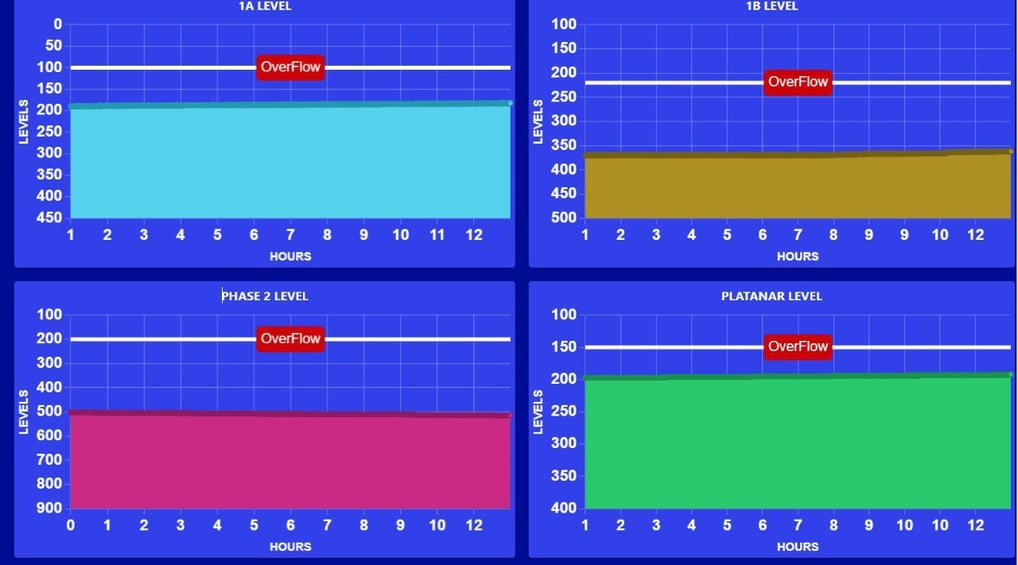
I developed a dashboard to visualize the water levels of the four main reservoirs in a hydroelectric plant:
Reservoir 1: 4.5m limit
Reservoir 2: 5m limit
Reservoir 3: 9m limit
Reservoir 4: 4m limit
To easily identify when an overflow was about to occur, I used ChartJS with React and added a reference line to highlight the overflow threshold.
For data collection and storage, I implemented NodeJS on the server side, a REST API, ReactJS, and ChartJS, ensuring real-time monitoring and better decision-making.
Dashboard for monitor water levels in 4 reservoirs
I developed a dashboard to visualize the water levels of the four main reservoirs in a hydroelectric plant